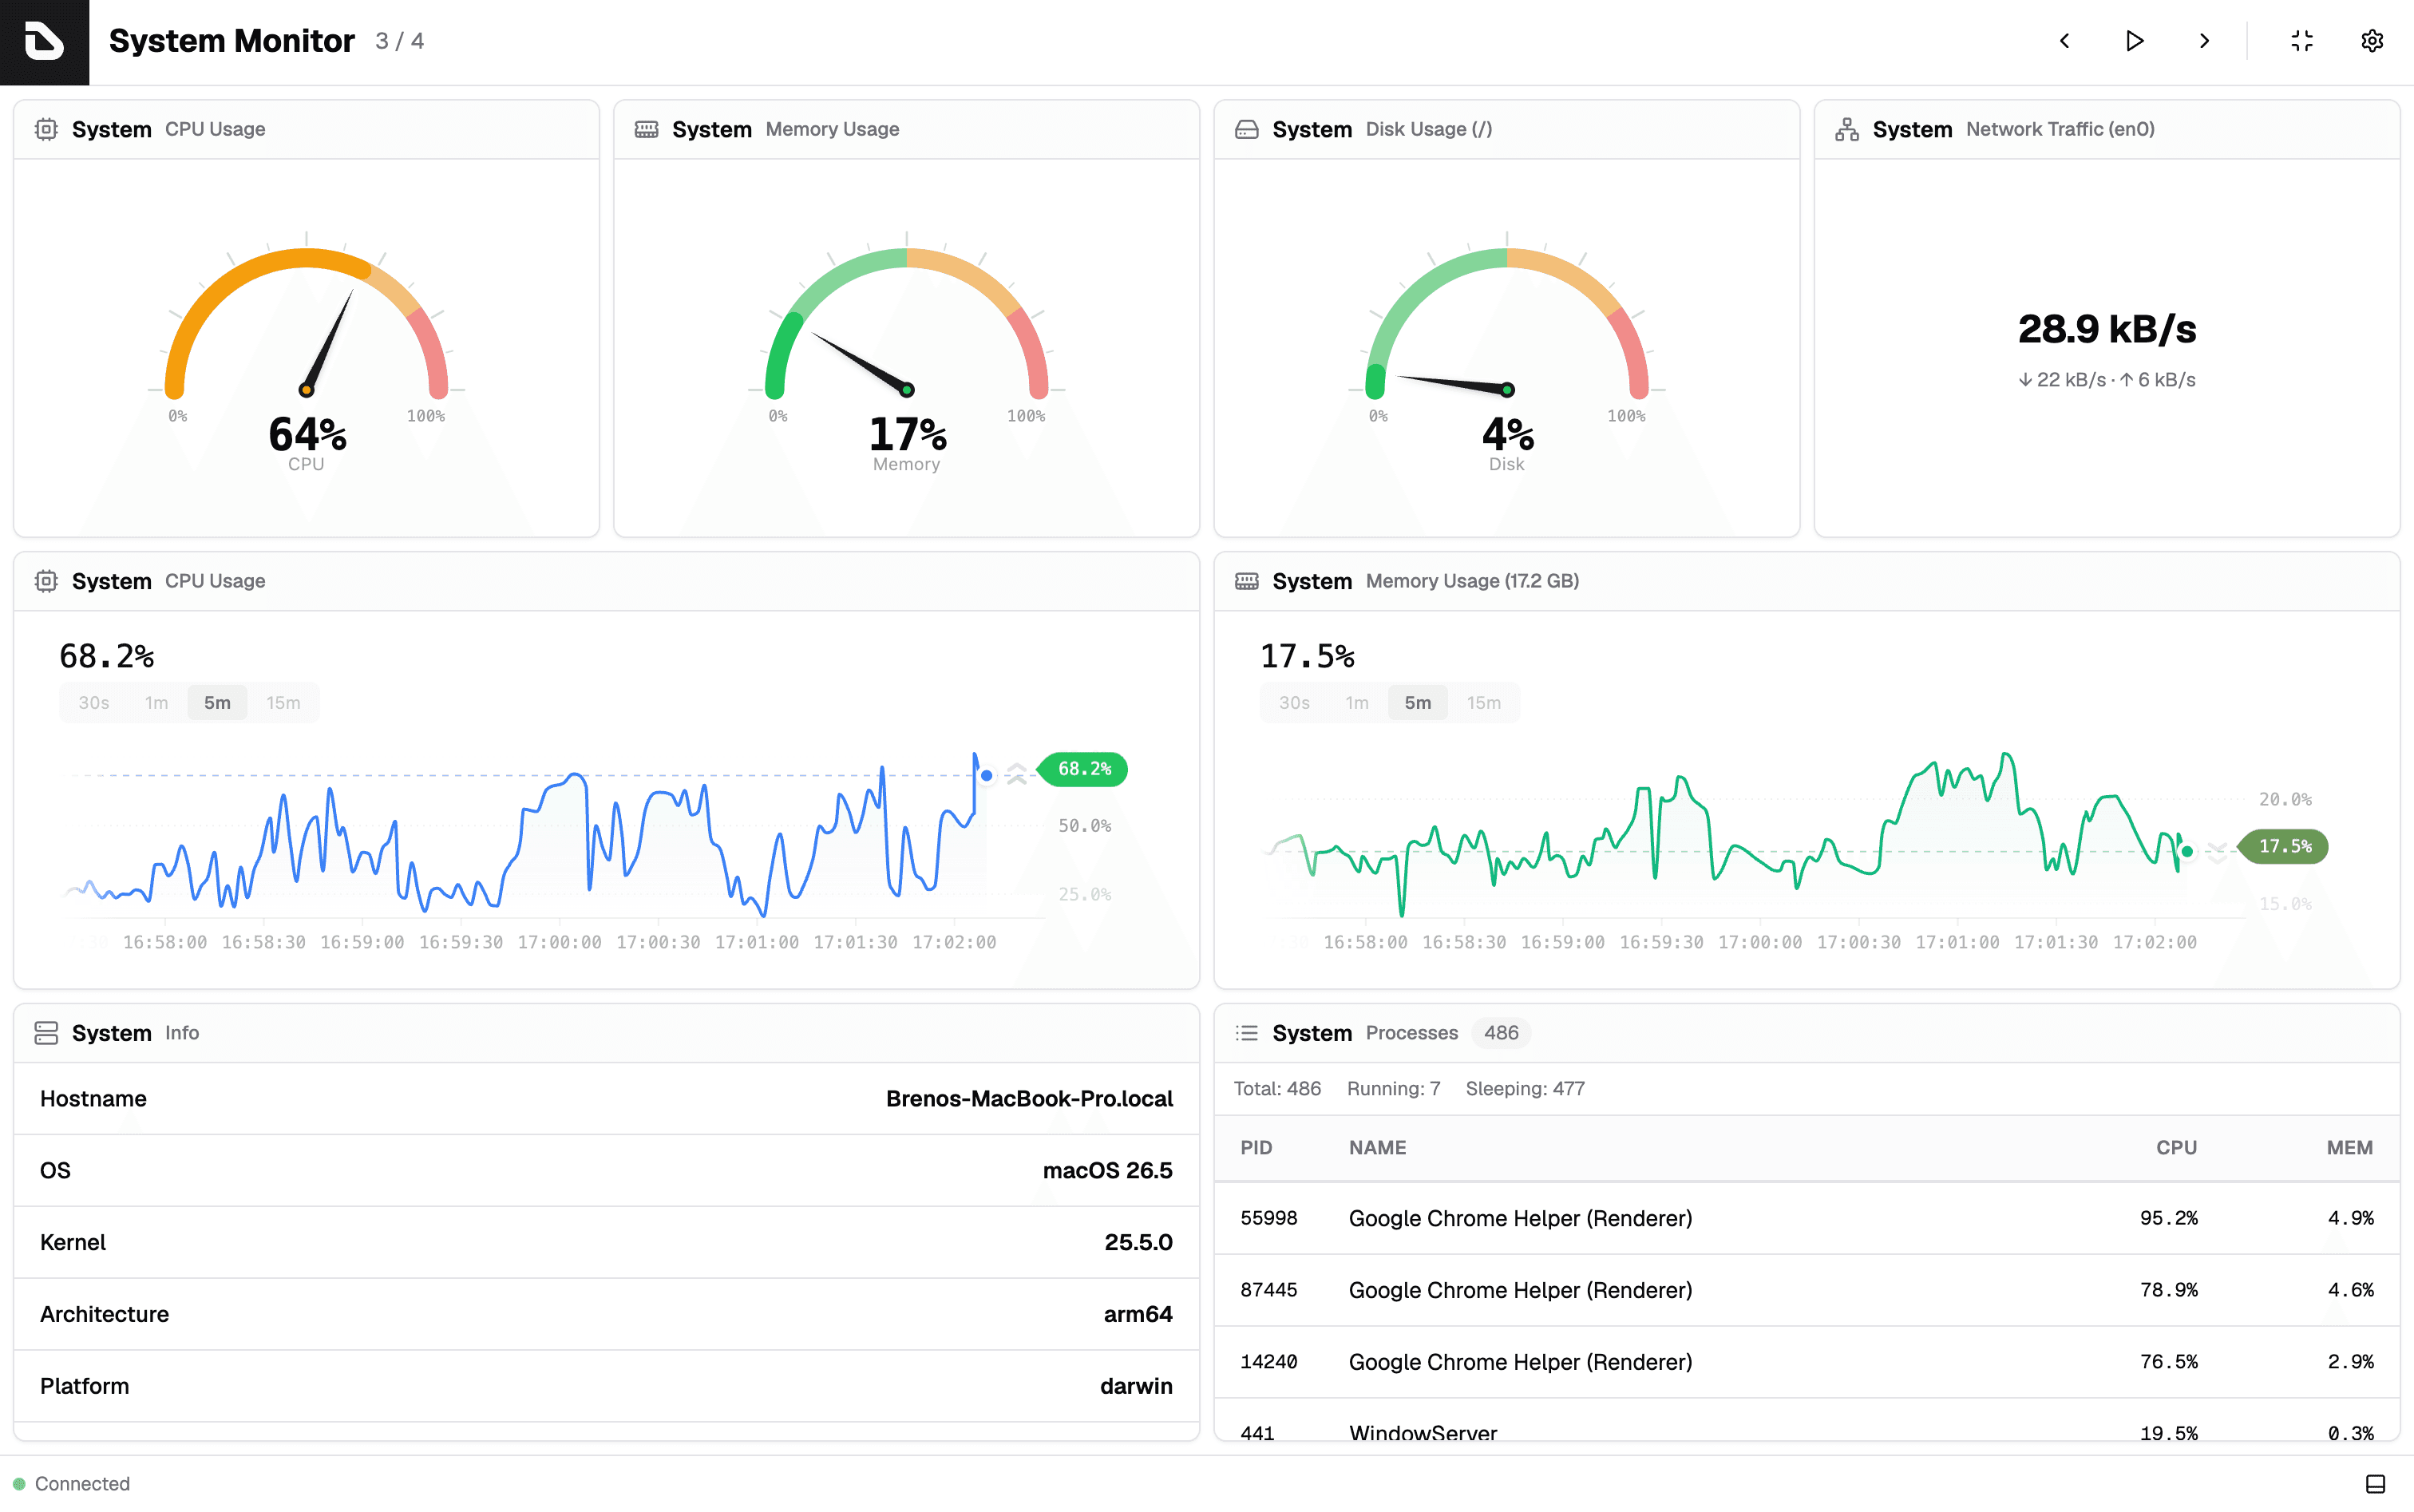
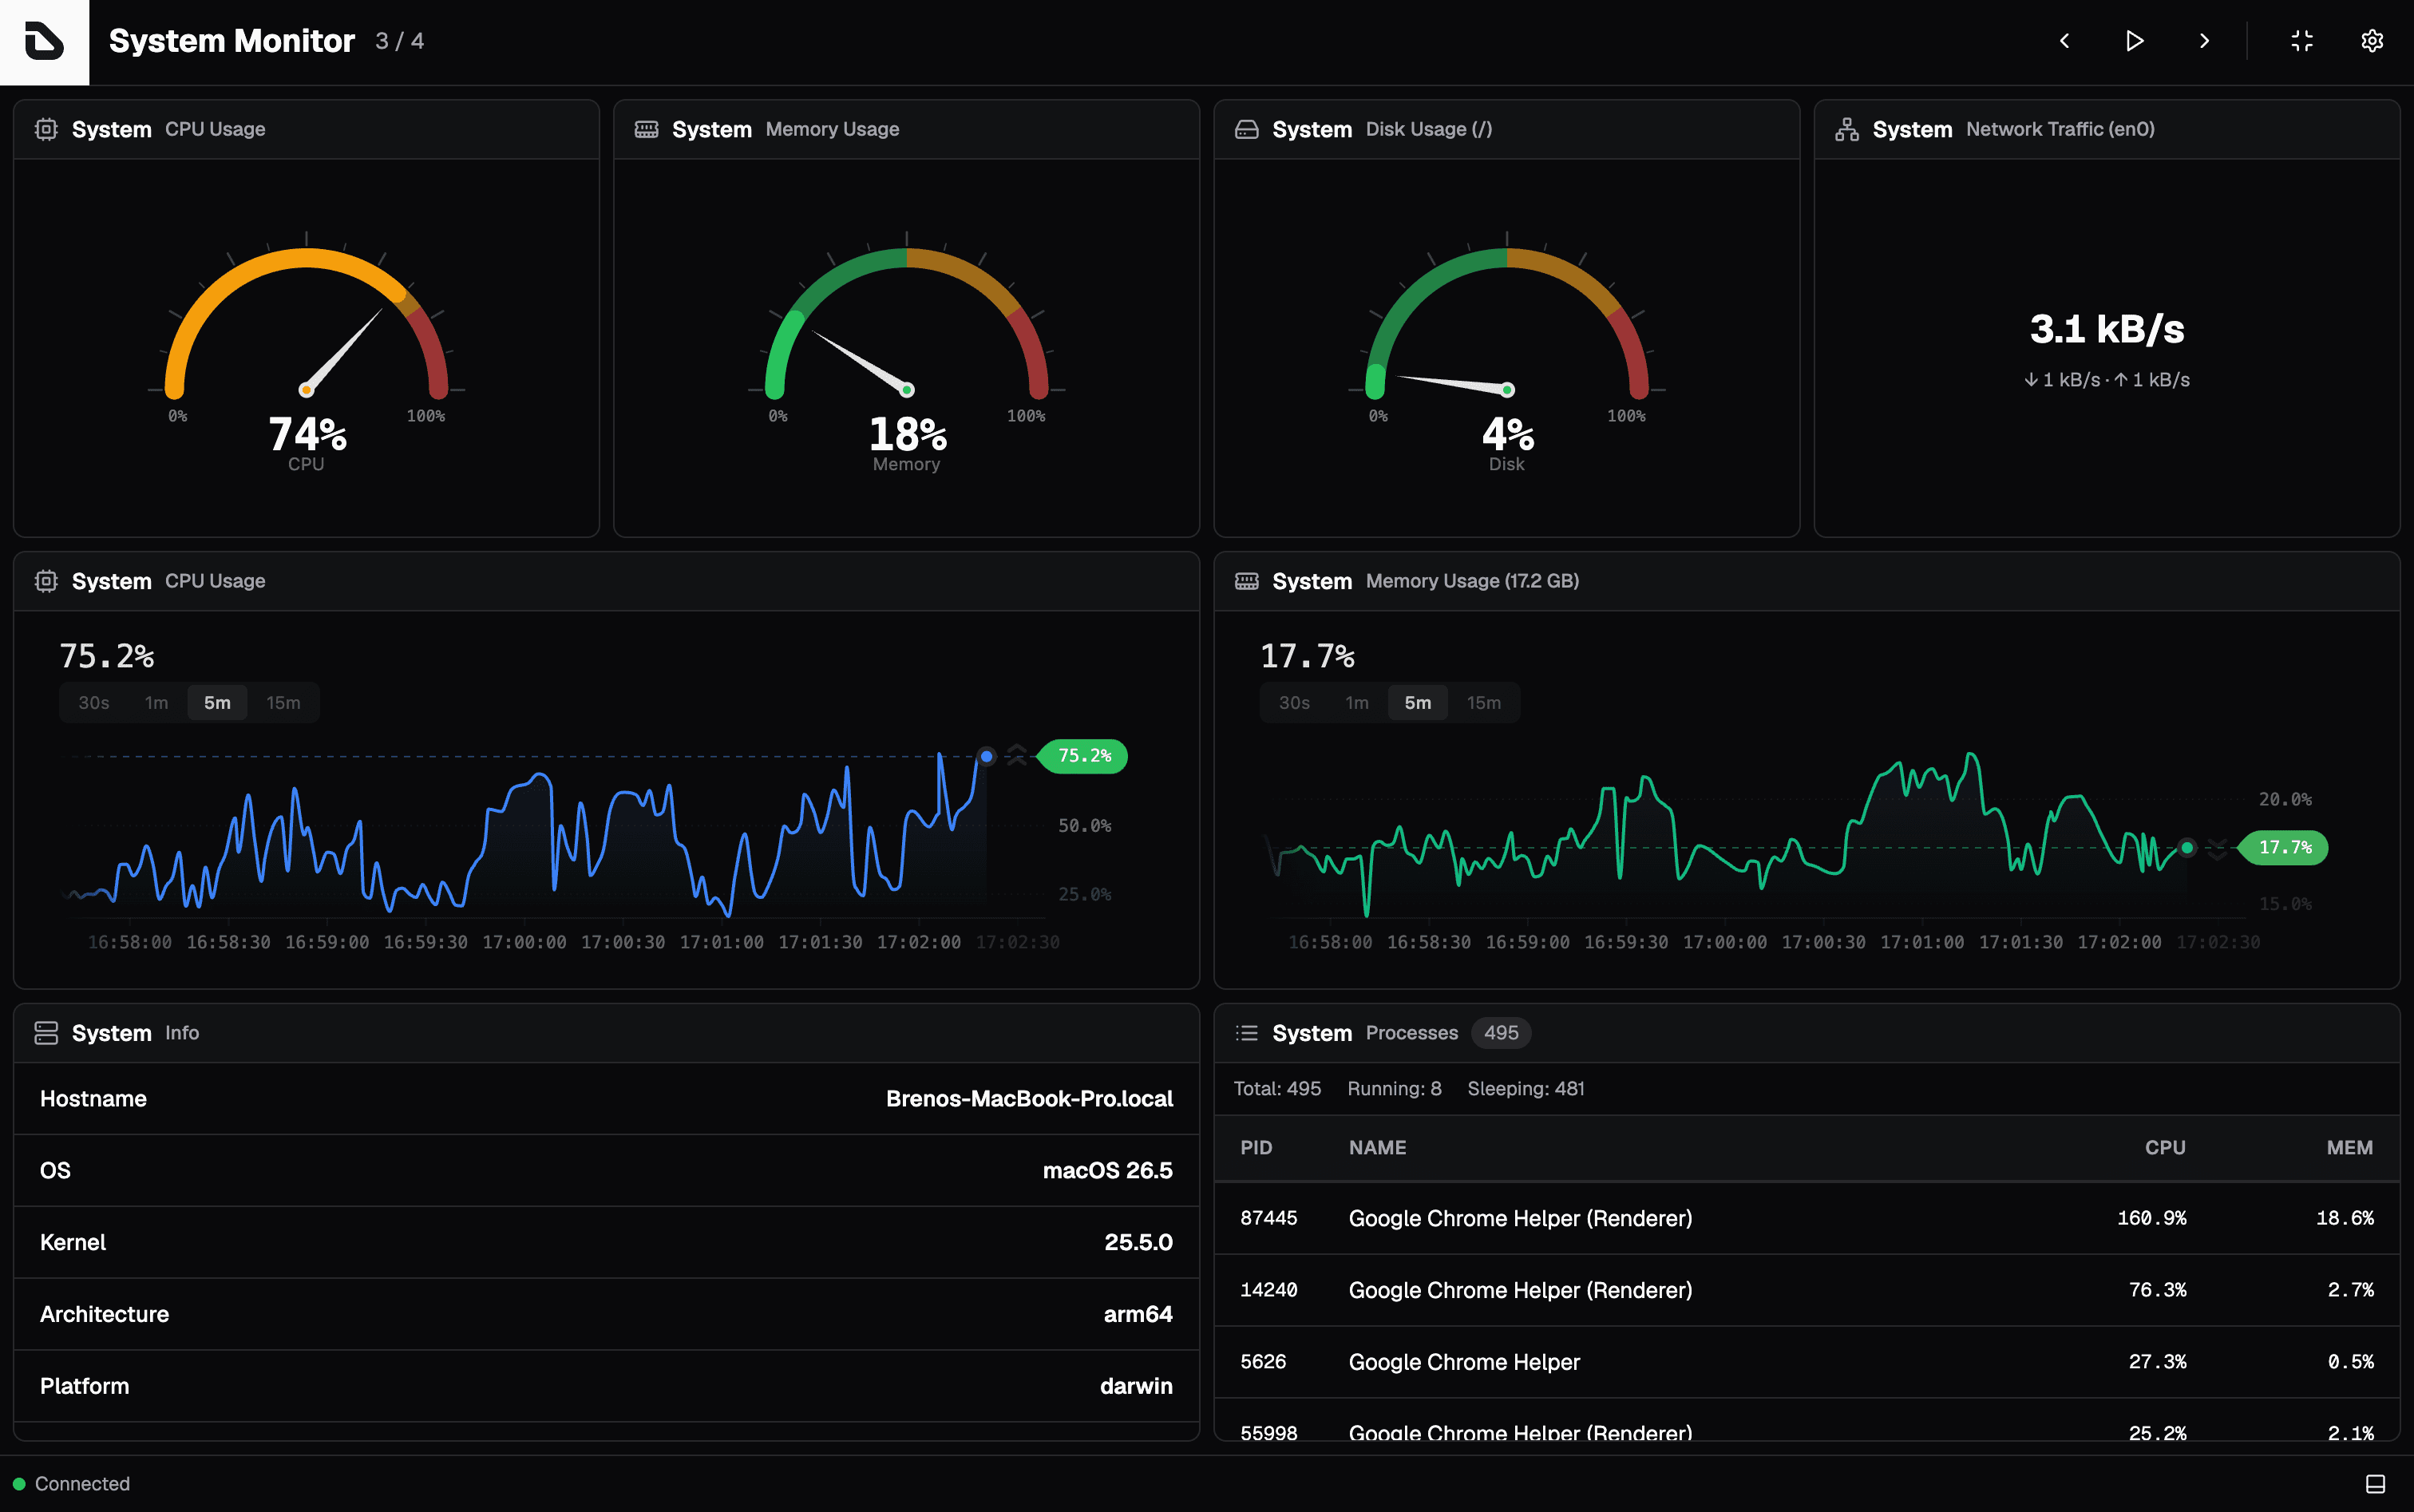
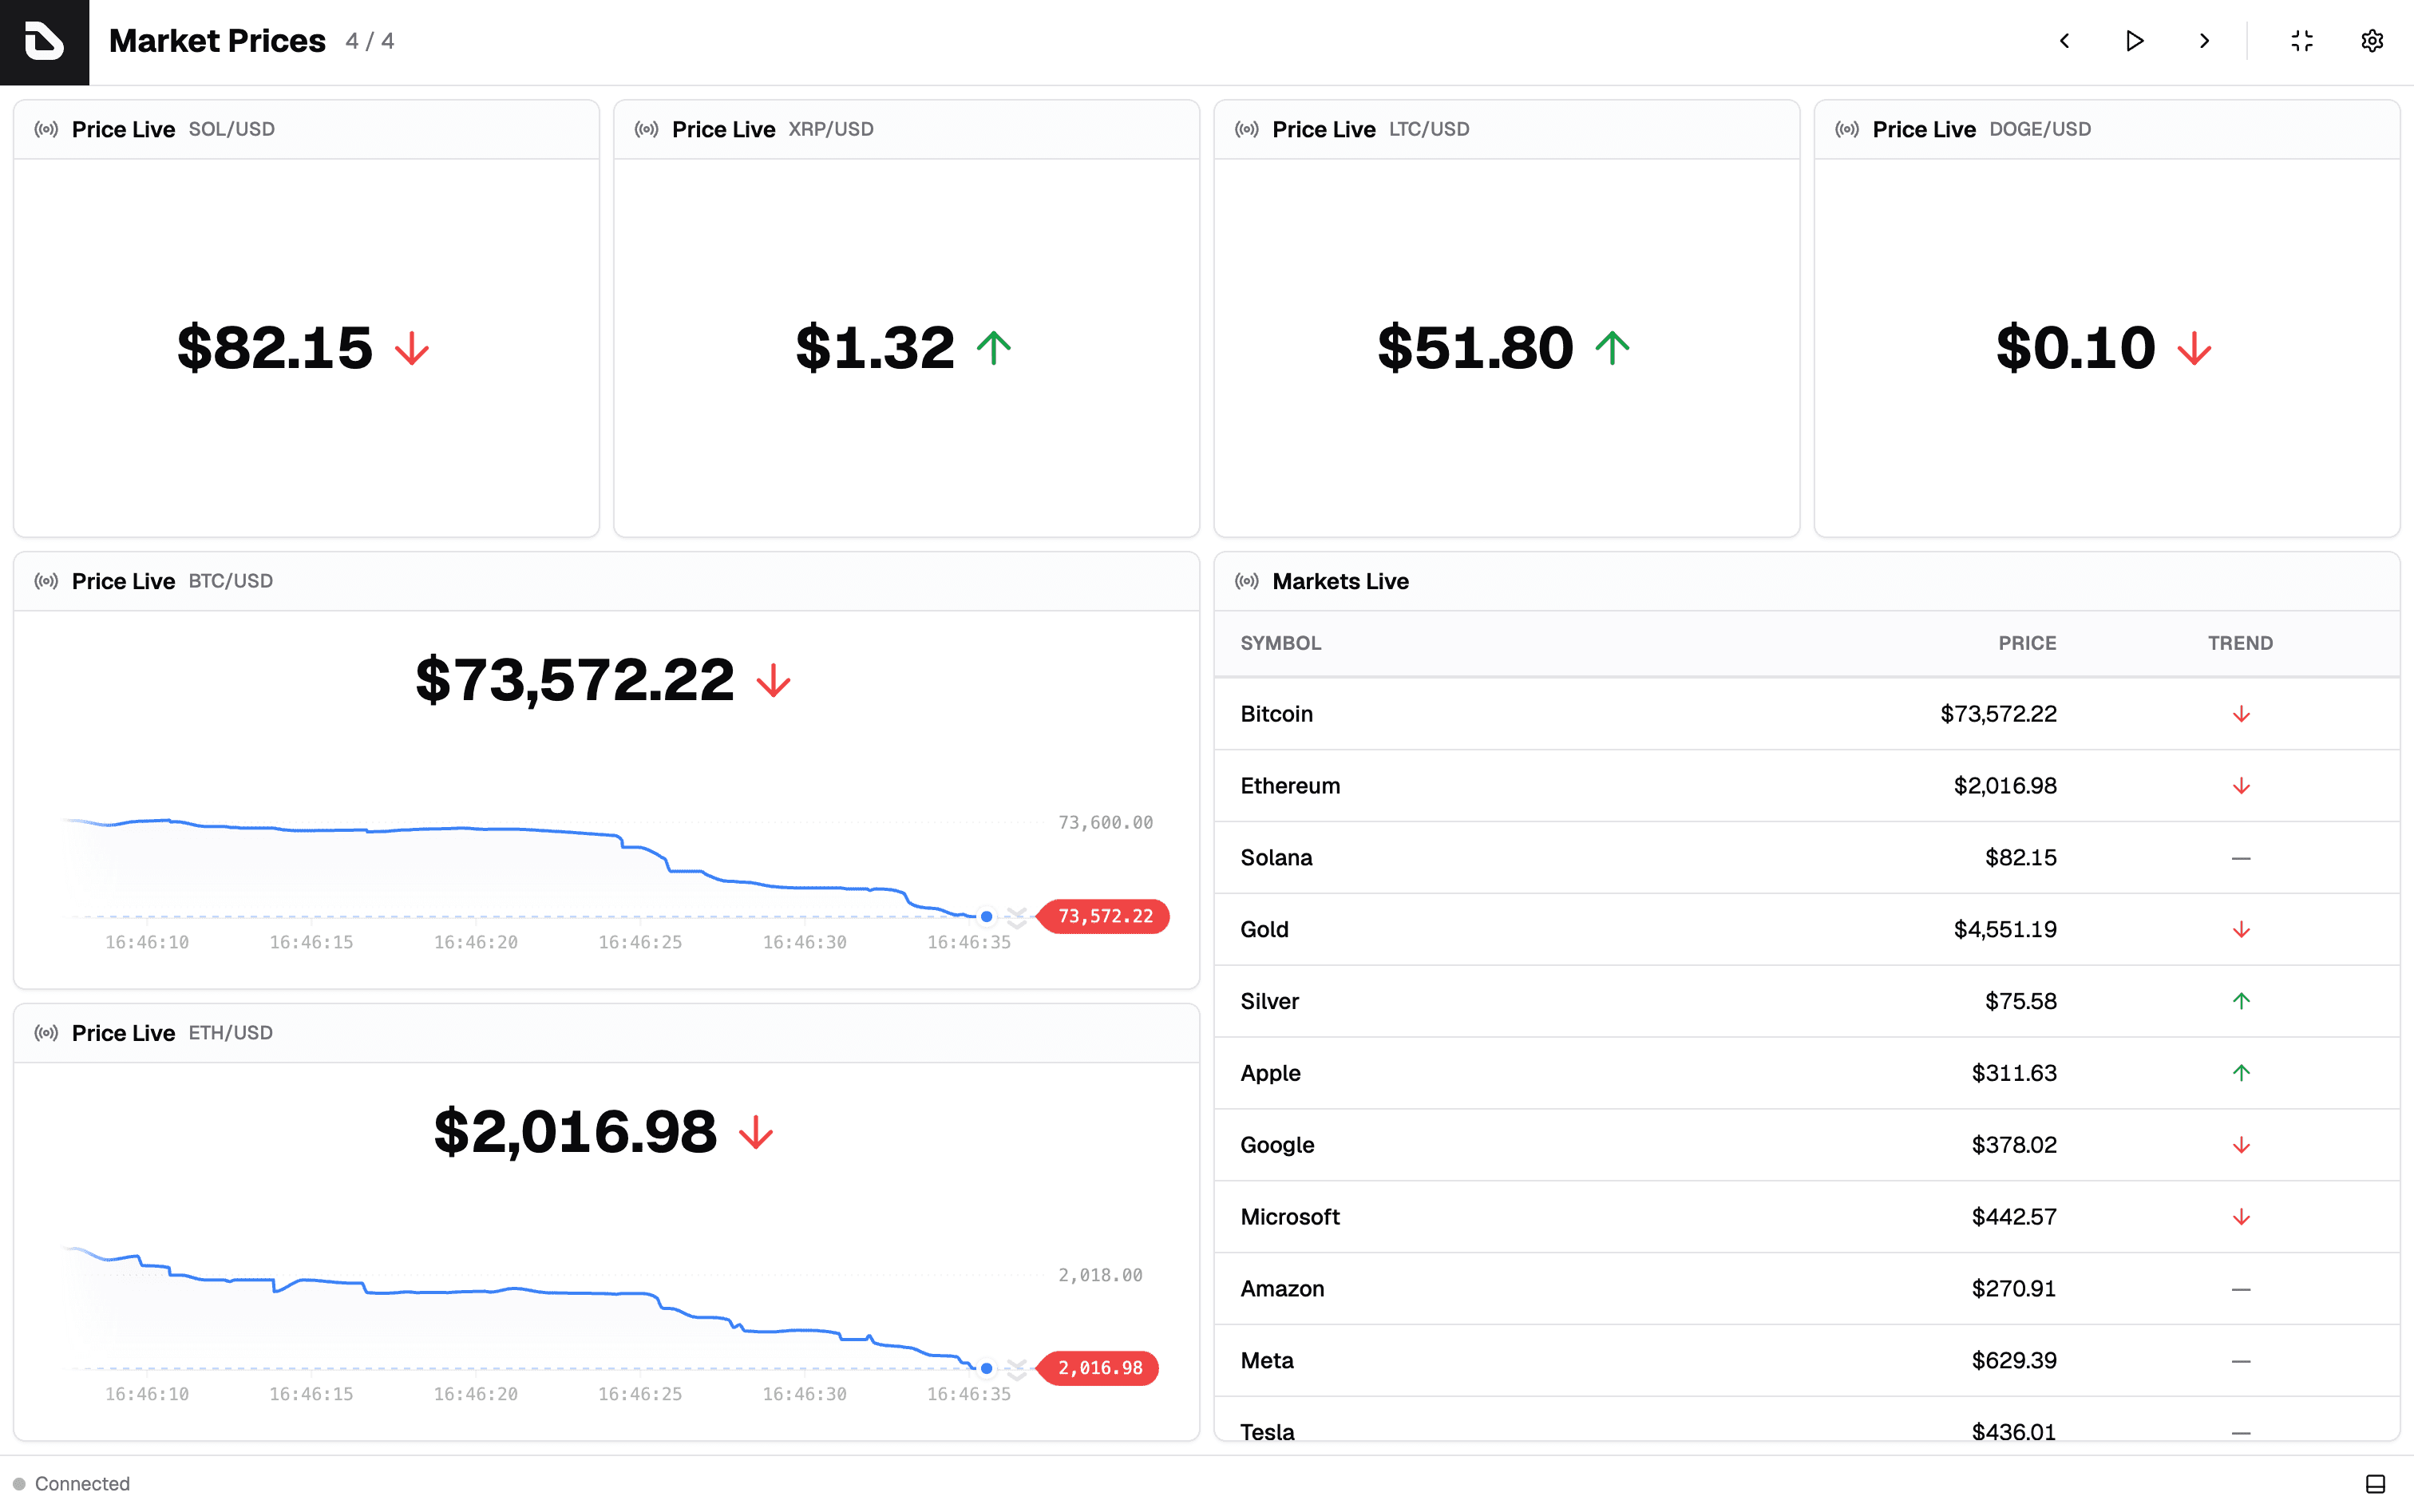
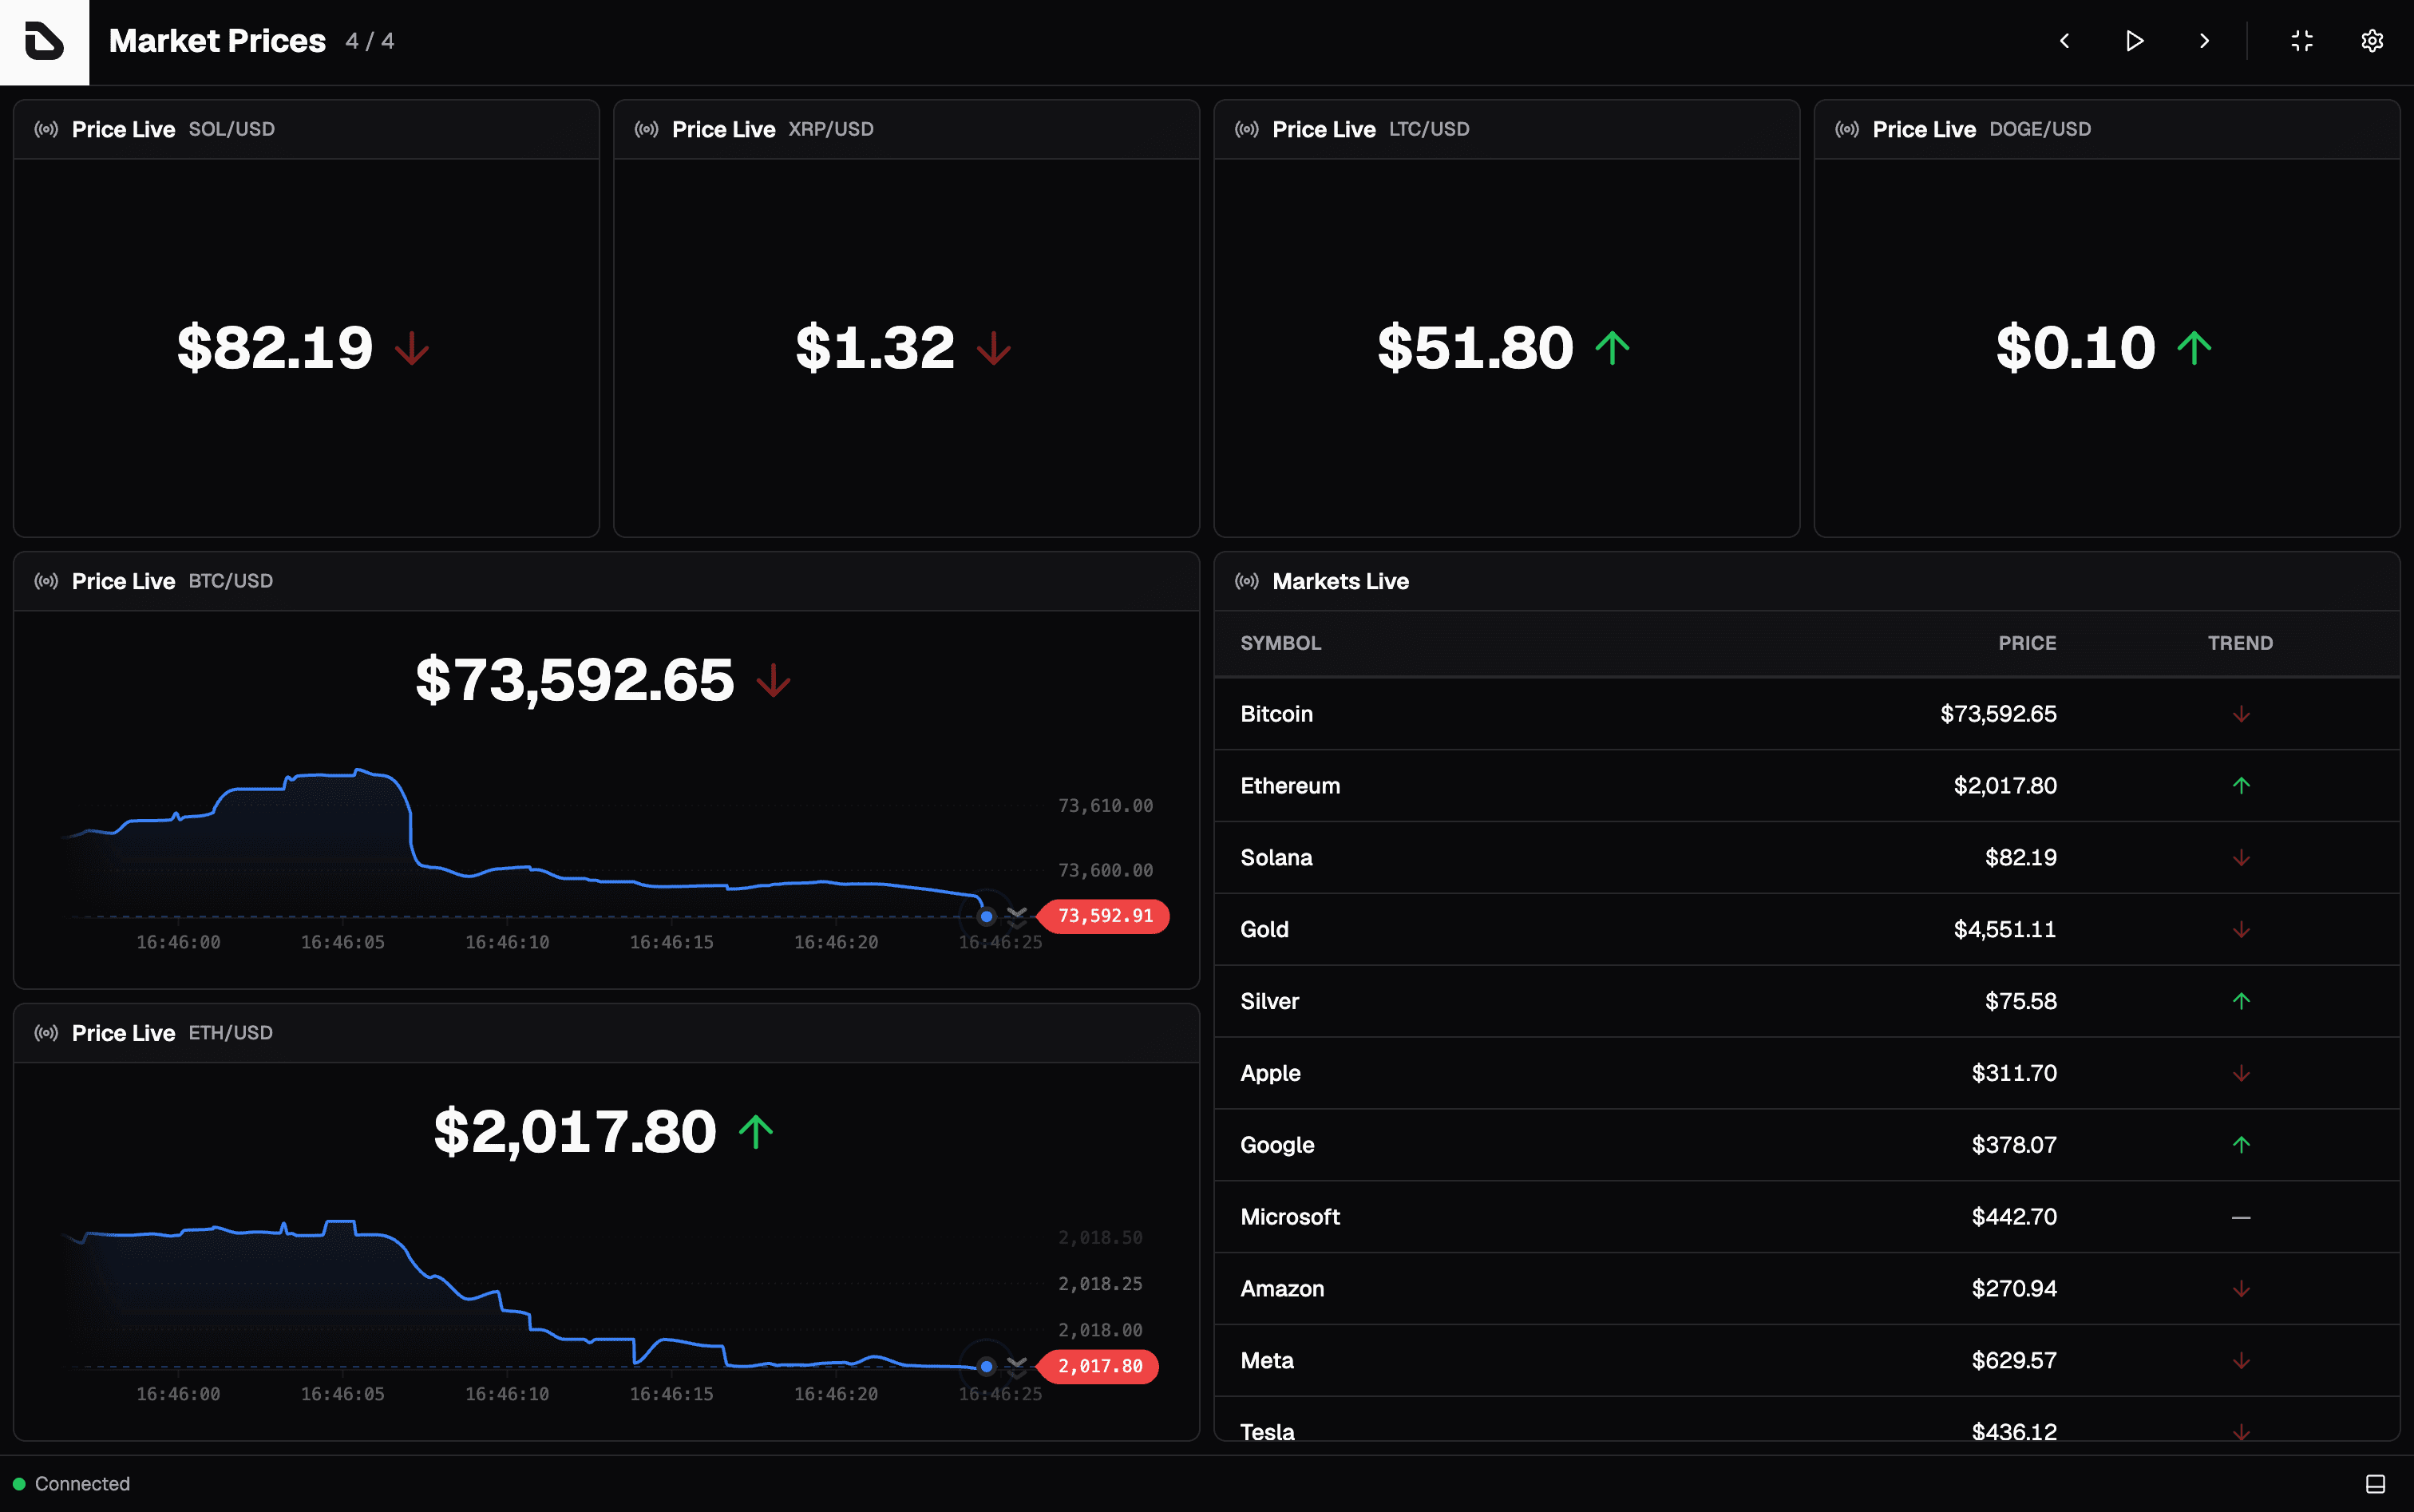
Step 01
Define dashboards as code
Write declarative configuration in TypeScript, JSON, or YAML. Version, review, and share dashboards alongside your codebase.
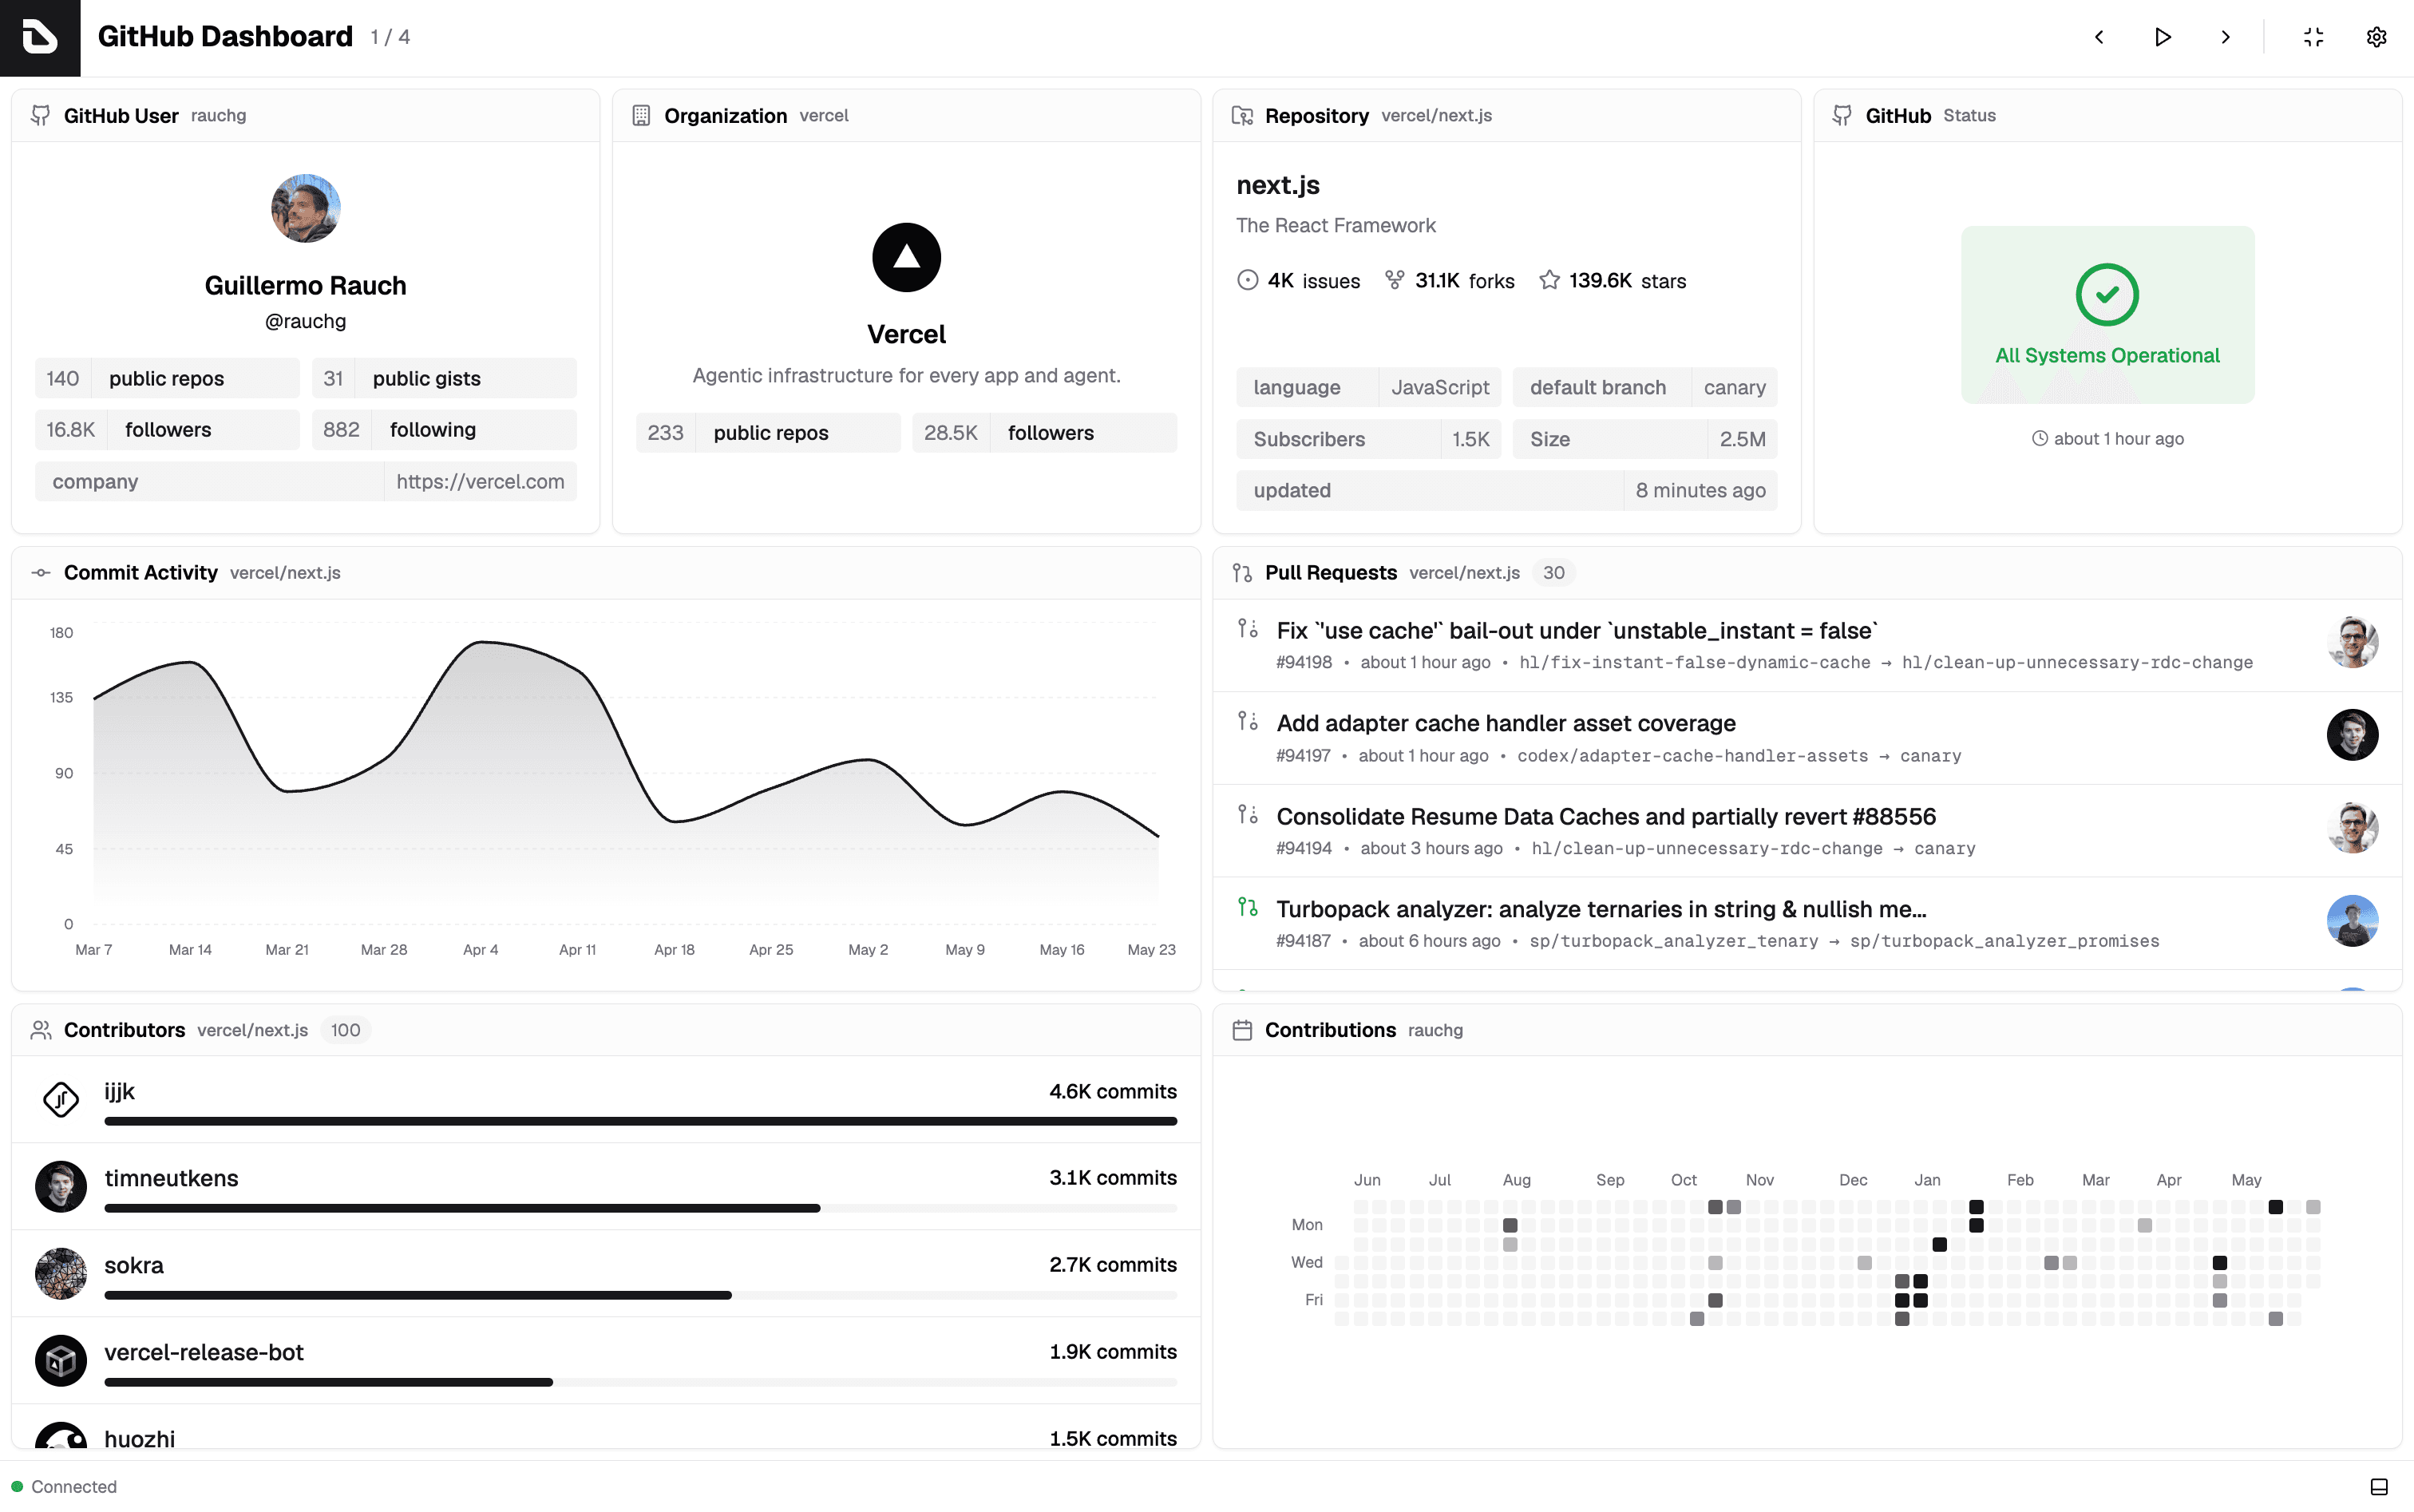
Dashfy uses a server–client architecture. The server loads dashboard configuration, connects to APIs, and pushes updates over WebSockets to a composable React client.
Write declarative configuration in TypeScript, JSON, or YAML. Version, review, and share dashboards alongside your codebase.
Register extensions like GitHub, system metrics, JSON APIs, or your own custom integrations as data providers.
The server loads configuration, manages API clients, and exposes data to clients through a real-time WebSocket runtime.
The client composes widgets from extensions, receives push updates, and renders responsive dashboards automatically.
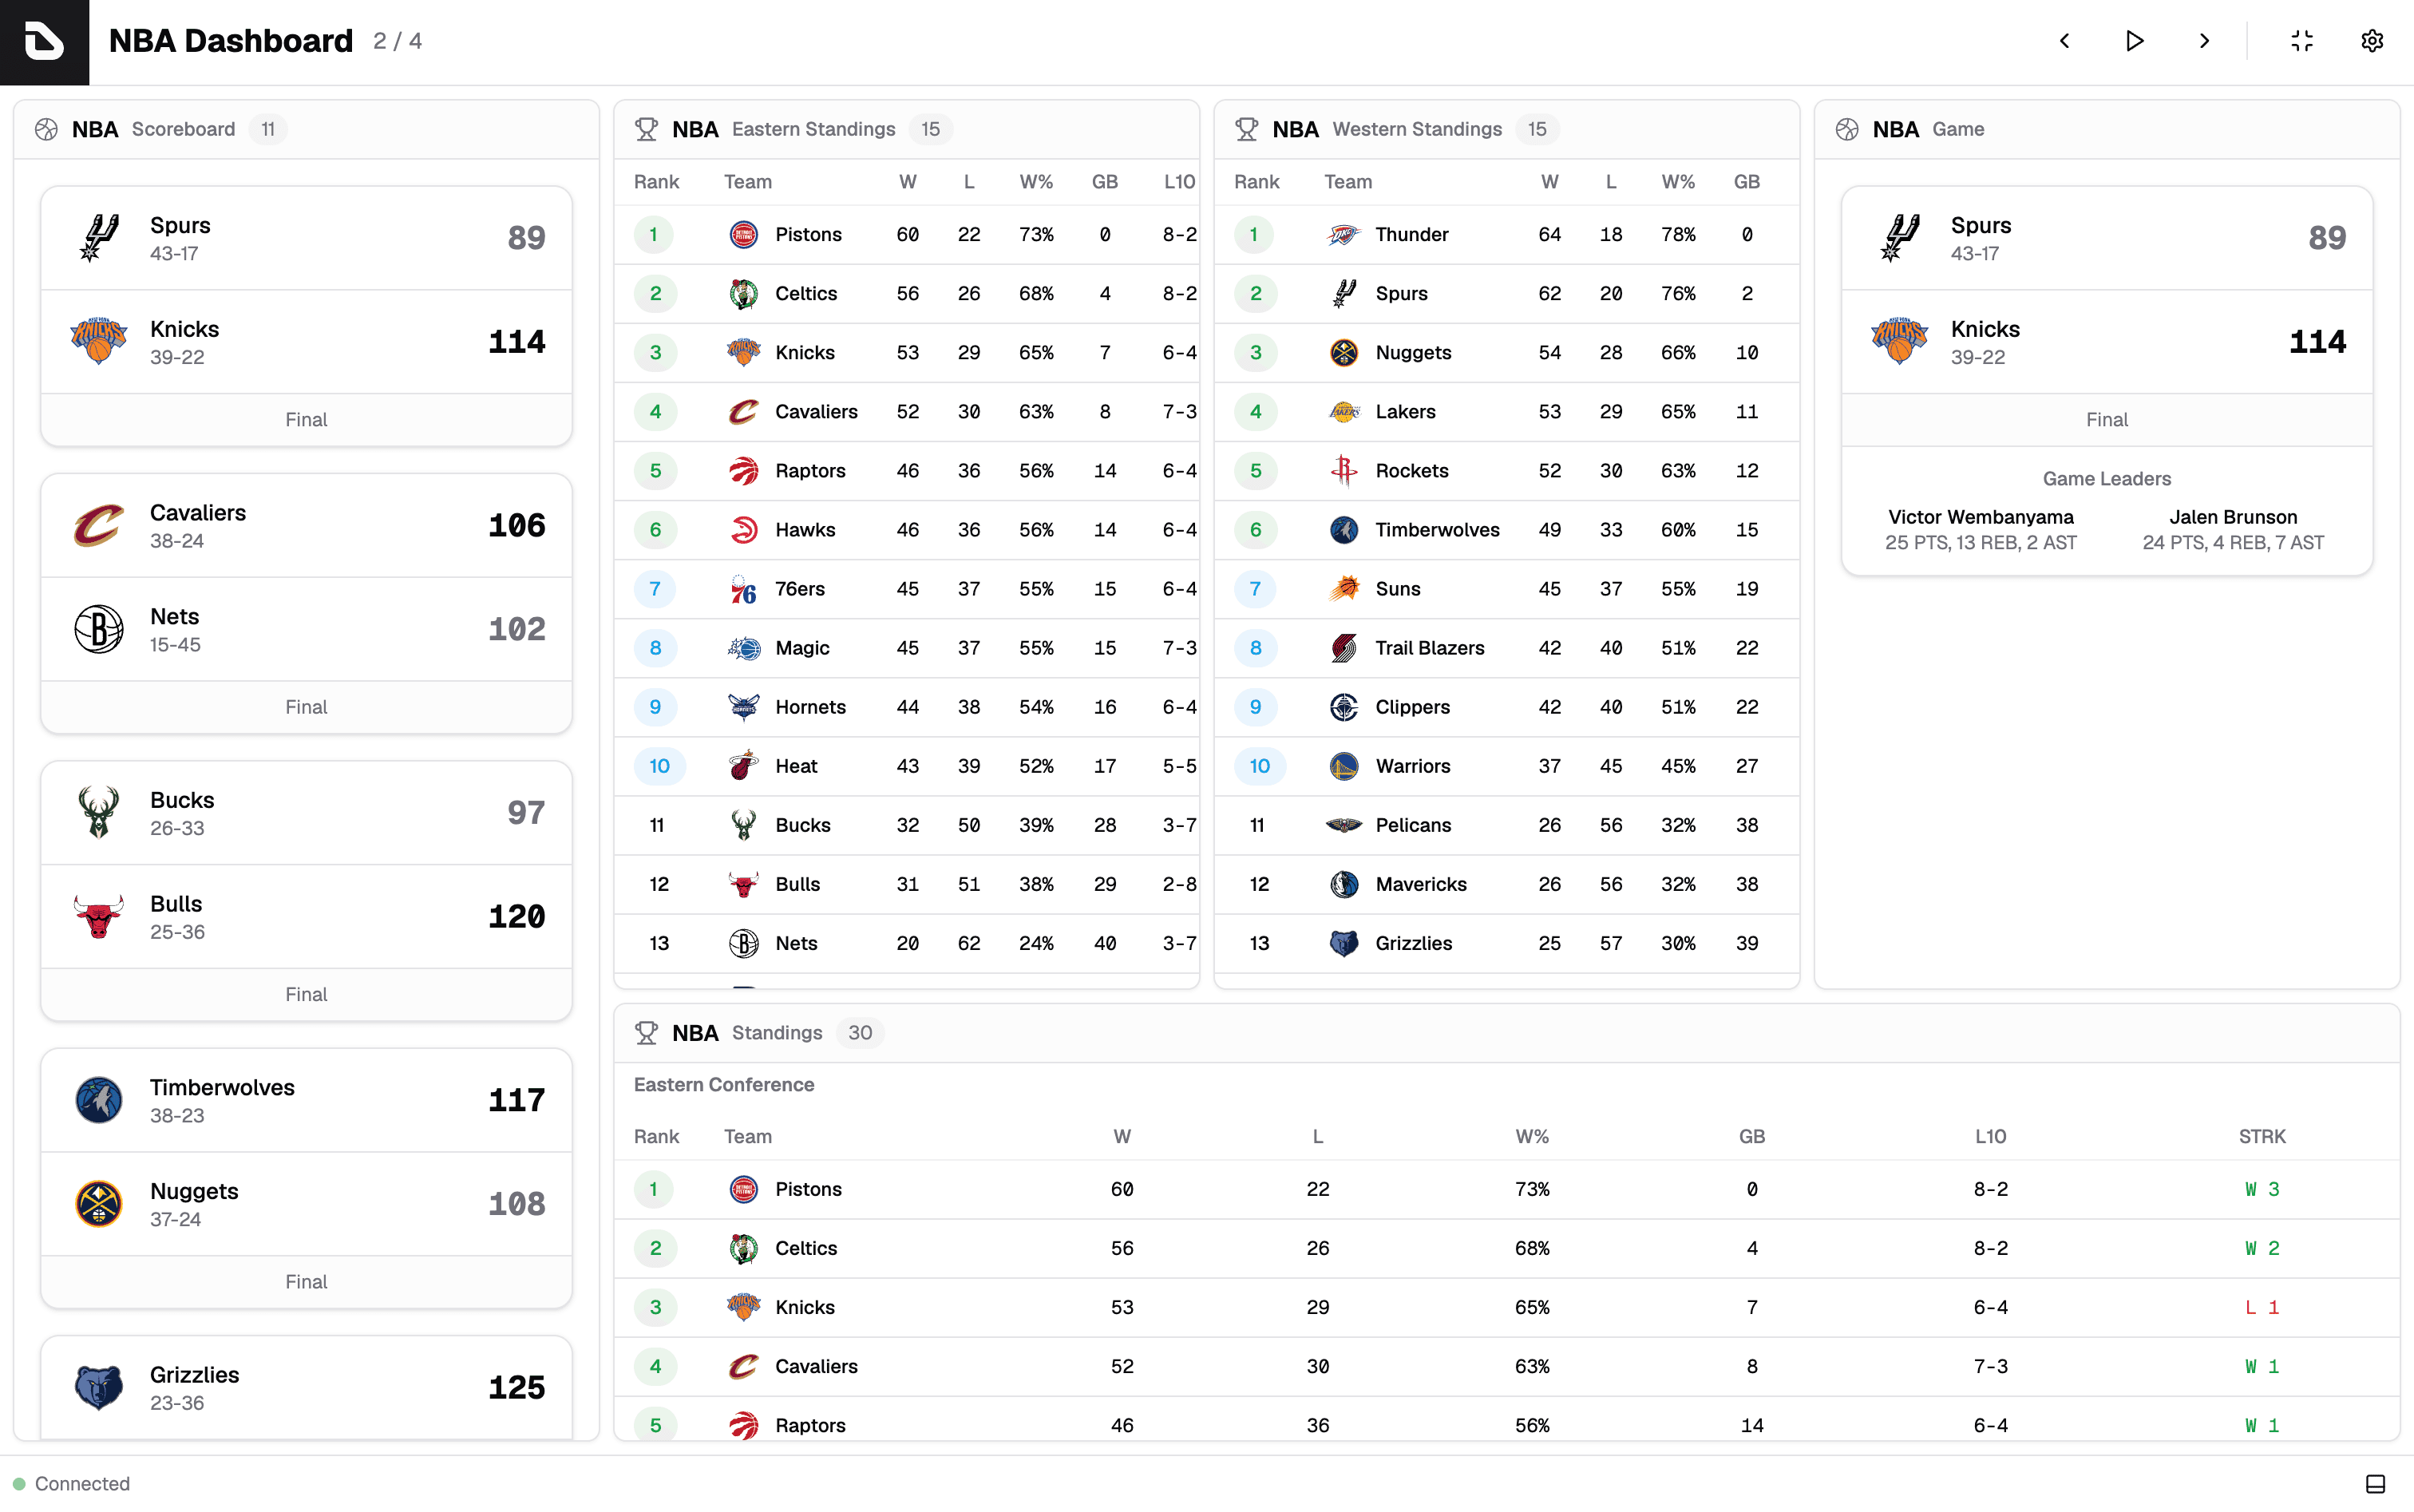
Dashfy ships with the building blocks for production-grade dashboards: declarative config, real-time updates, themes, extensions, and a composable React UI.
Define dashboards as structured TypeScript, JSON, or YAML. Versioned, reviewable, reproducible.
Server-client architecture built on WebSockets and subscriptions. No polling hacks, no manual refresh.
Add widgets and data sources through extensions. Connect to any API or service without forking the core.
Compose responsive dashboards across screen sizes with a simple grid model and reusable widgets.
Define and rotate through multiple dashboards automatically — perfect for kiosk and TV displays.
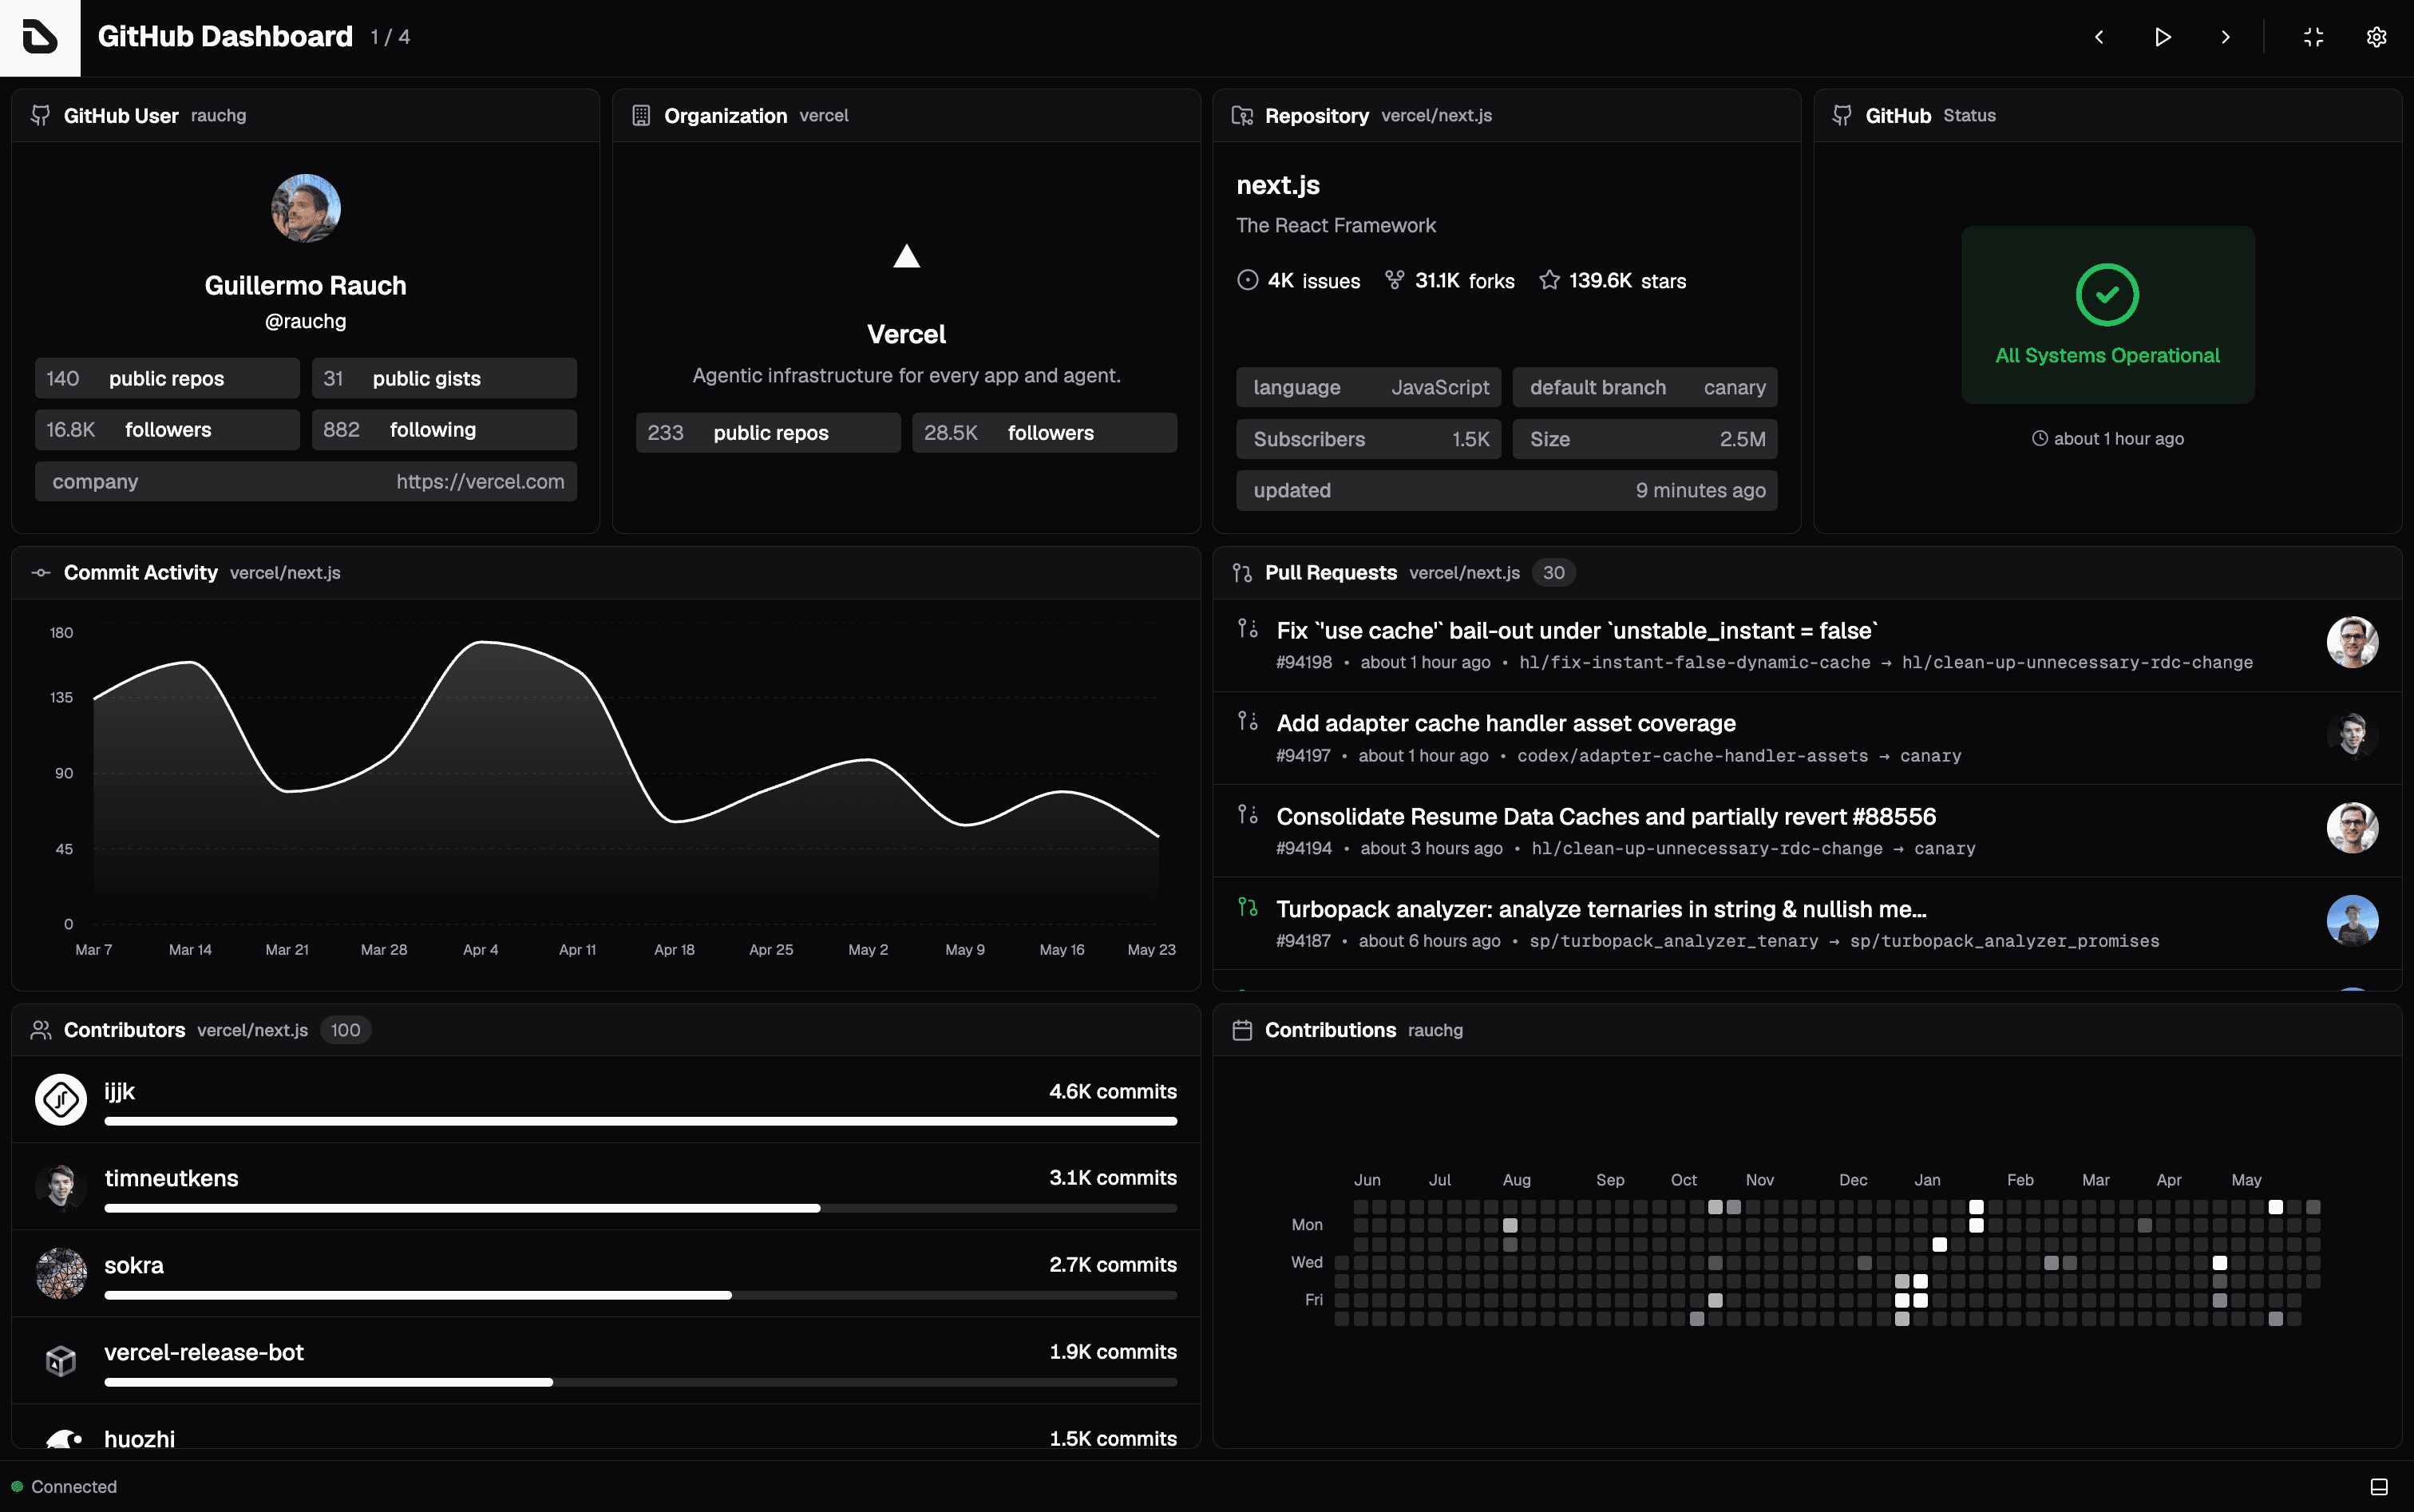
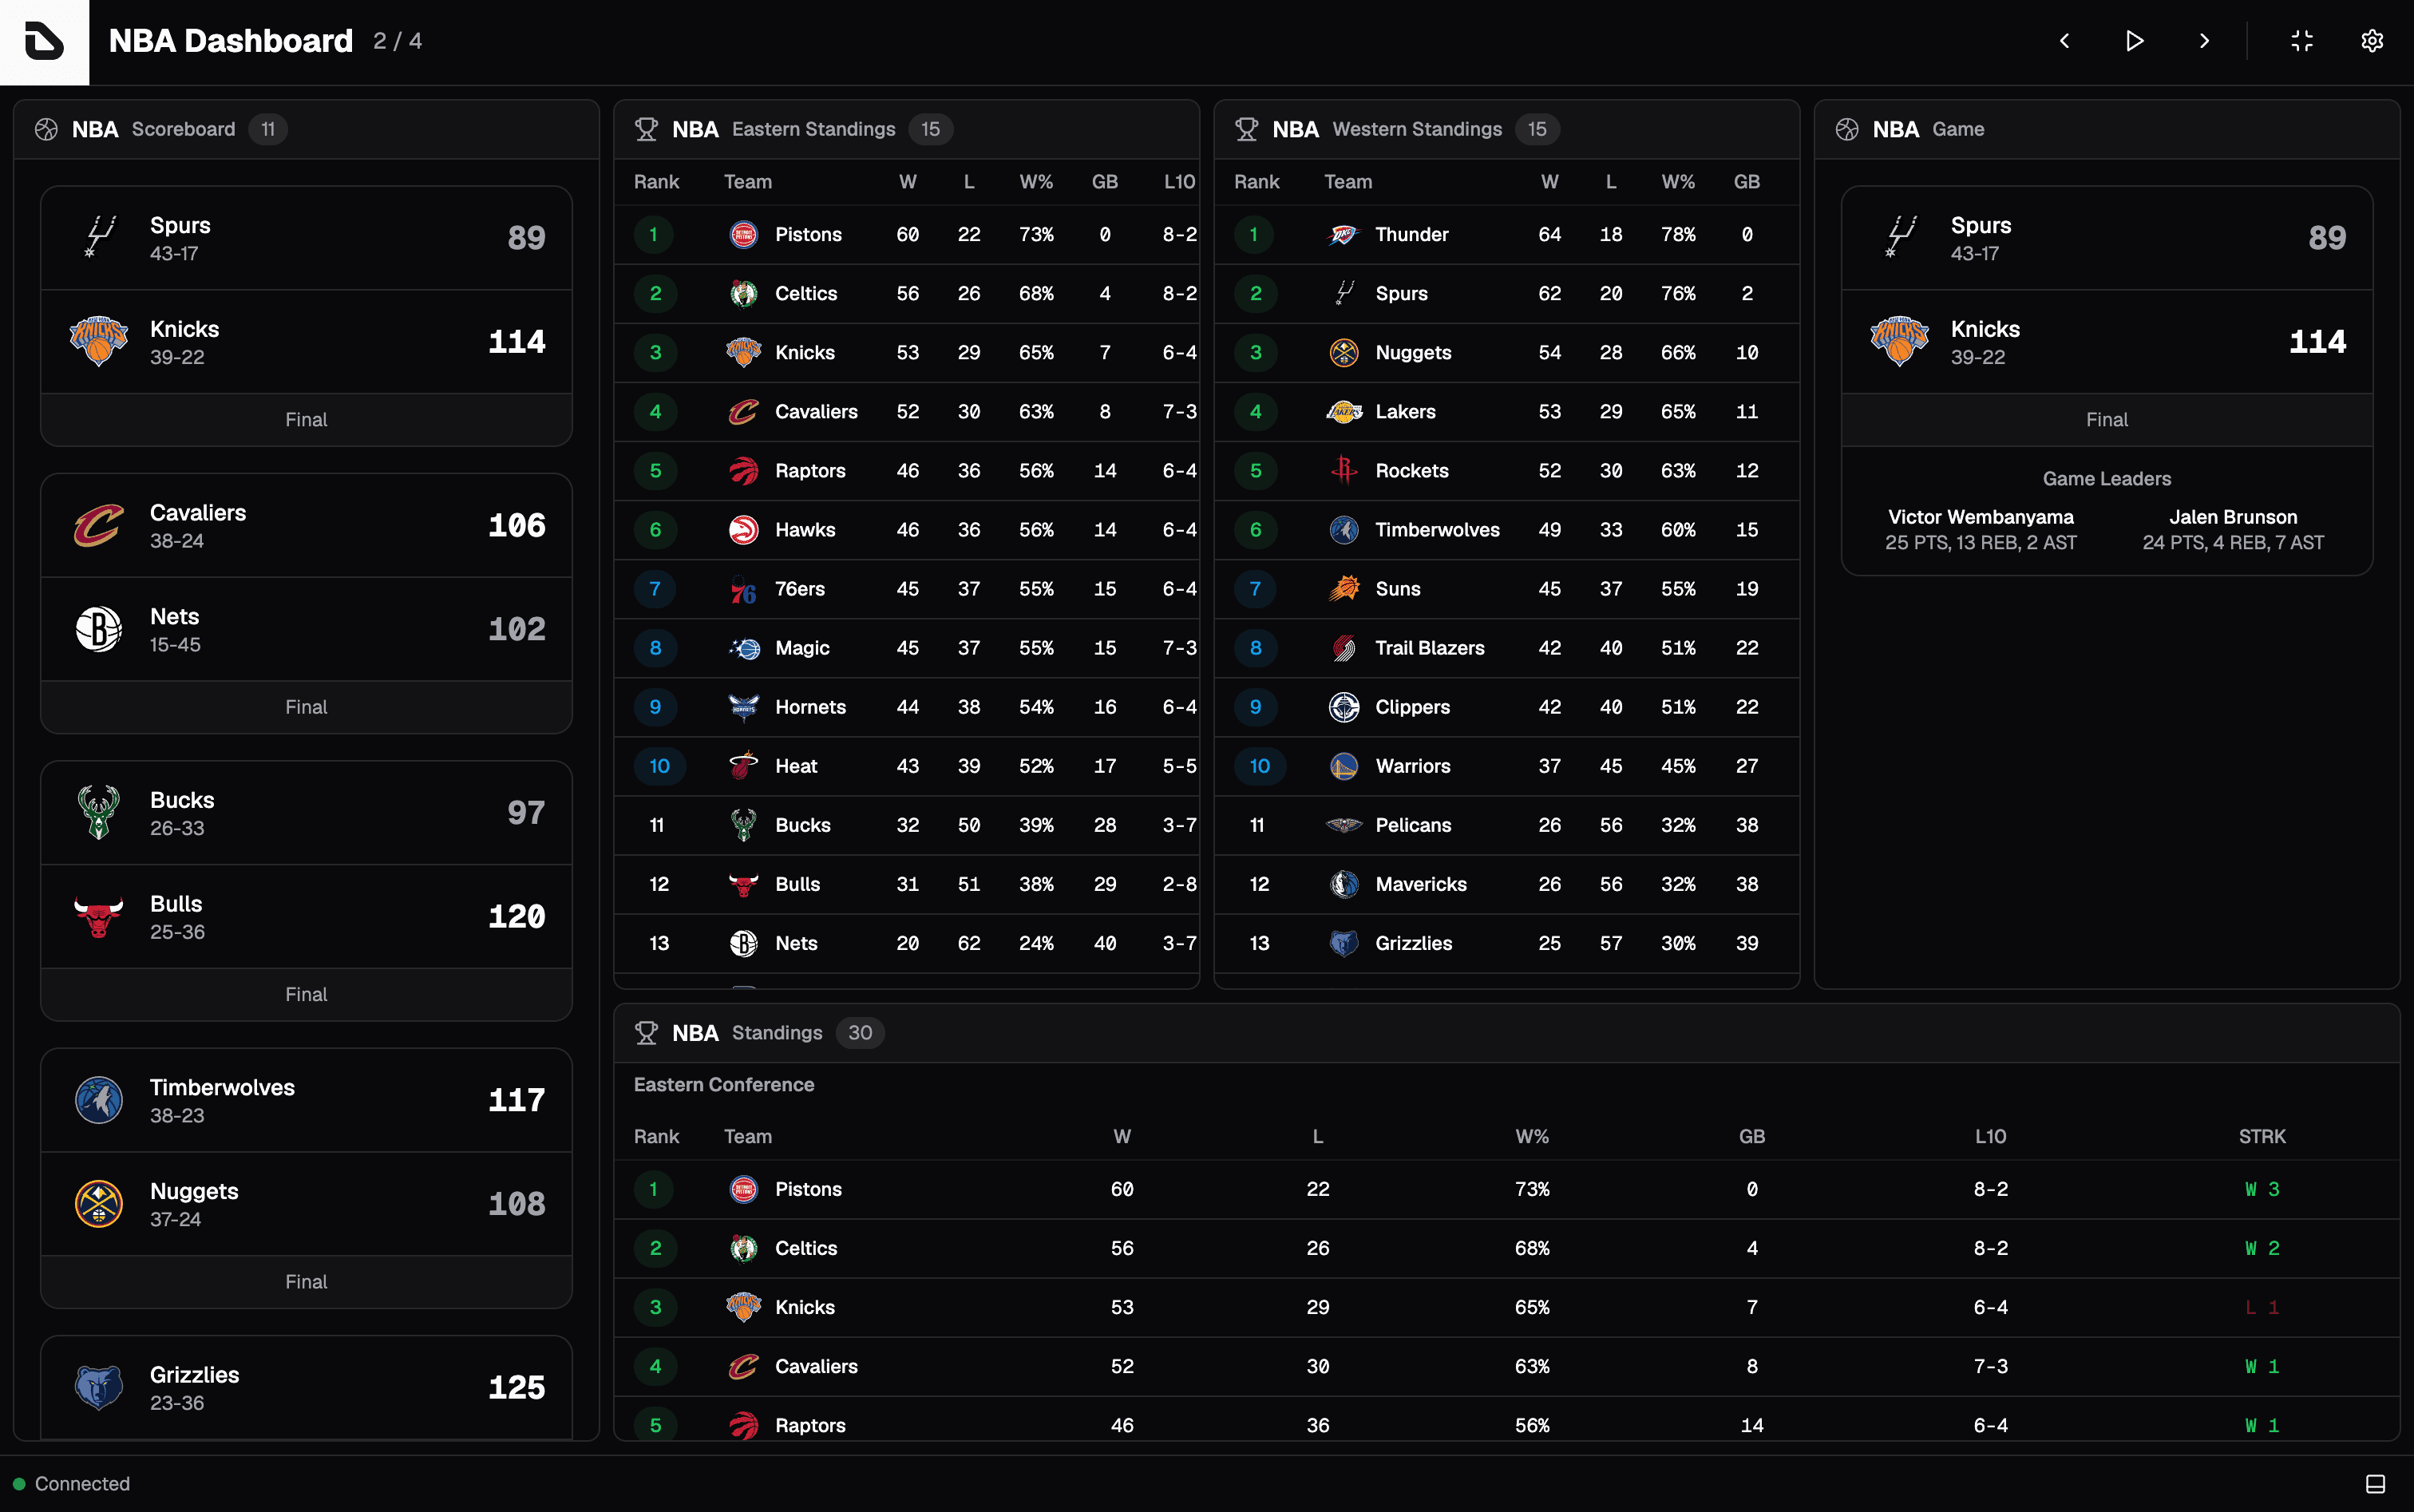
Built-in themes, light and dark mode, and full support for custom themes you can ship with your app.
Keep dashboards alive on always-on displays without dimming or sleep interrupting your monitoring.
Productivity-focused shortcuts for navigating dashboards, panels, and settings without leaving the keyboard.
Fully typed configuration, APIs, and widgets for safety, autocompletion, and refactor-friendly DX.
Designed for live displays, internal tools, monitoring screens, and developer-facing dashboards.
Lock dashboards behind a PIN to keep kiosk and ops displays safe from accidental edits or unauthorized access.
Describe your dashboard in natural language and let the AI agent compile it into a typed Dashfy configuration.
Three small files take a dashboard from idea to live in the browser.
Declarative configuration alongside your codebase. Version, review, and share dashboards as plain text.
title: GitHub Dashboard
columns: 3
rows: 2
widgets:
  - extension: github
    widget: RepoBadge
    x: 0
    y: 0
    columns: 1
    rows: 1
    repository: react/react
  - extension: github
    widget: PullRequests
    x: 1
    y: 0
    columns: 2
    rows: 1
    repository: vercel/next.js
    state: open
  - extension: json
    widget: JsonStatus
    x: 0
    y: 1
    columns: 3
    rows: 1
    title: API Status
url: https://api.example.com/healthSet up extensions on the Dashfy server, hand them credentials, and start streaming data over WebSockets.
import { createGitHubClient } from '@getdashfy/ext-github/client'
import { createSystemClient } from '@getdashfy/ext-system/client'
import { Dashfy } from '@getdashfy/server'

const dashfy = new Dashfy()

await dashfy.configureFromFile('./dashfy.config.yml')

dashfy.registerApi(
  'github',
  createGitHubClient({ token: process.env.GITHUB_TOKEN! }),
)

dashfy.registerApi('system', createSystemClient(), 'push')

await dashfy.start()Register widget extensions in the browser and render the live dashboard with a single component.
import { PullRequests, RepoBadge } from '@getdashfy/ext-github'
import { CpuUsageLine, MemoryUsageGauge } from '@getdashfy/ext-system'
import { Dashfy, WidgetRegistry } from '@getdashfy/ui'

WidgetRegistry.addExtension('github', {
  PullRequests,
  RepoBadge,
})

WidgetRegistry.addExtension('system', {
  CpuUsageLine,
  MemoryUsageGauge,
})

export const App = () => {
  return <Dashfy />
}title: GitHub Dashboard
columns: 3
rows: 2
widgets:
- extension: github
widget: RepoBadge
x: 0
y: 0
columns: 1
rows: 1
repository: react/react
- extension: github
widget: PullRequests
x: 1
y: 0
columns: 2
rows: 1
repository: vercel/next.js
state: open
- extension: json
widget: JsonStatus
x: 0
y: 1
columns: 3
rows: 1
title: API Status
url: https://api.example.com/healthWhether you're monitoring services, building internal tools, or running TV dashboards, Dashfy keeps your dashboards declarative and real time.
Monitor APIs, services, CI/CD pipelines, and infrastructure side-by-side with your code.
Operational dashboards for internal metrics and system health without building a UI from scratch.
Visualize API responses, service status, and external integrations in real time.
Track deployments, system metrics, and service health across environments and clusters.
WebSockets and subscriptions make Dashfy a fit for live dashboards and operational displays.
Fullscreen mode, rotation, and continuous display make Dashfy ideal for TV monitoring screens.
Try the live demo, read the docs, or jump straight into the source. Dashfy is open source and ready to drop into your stack.